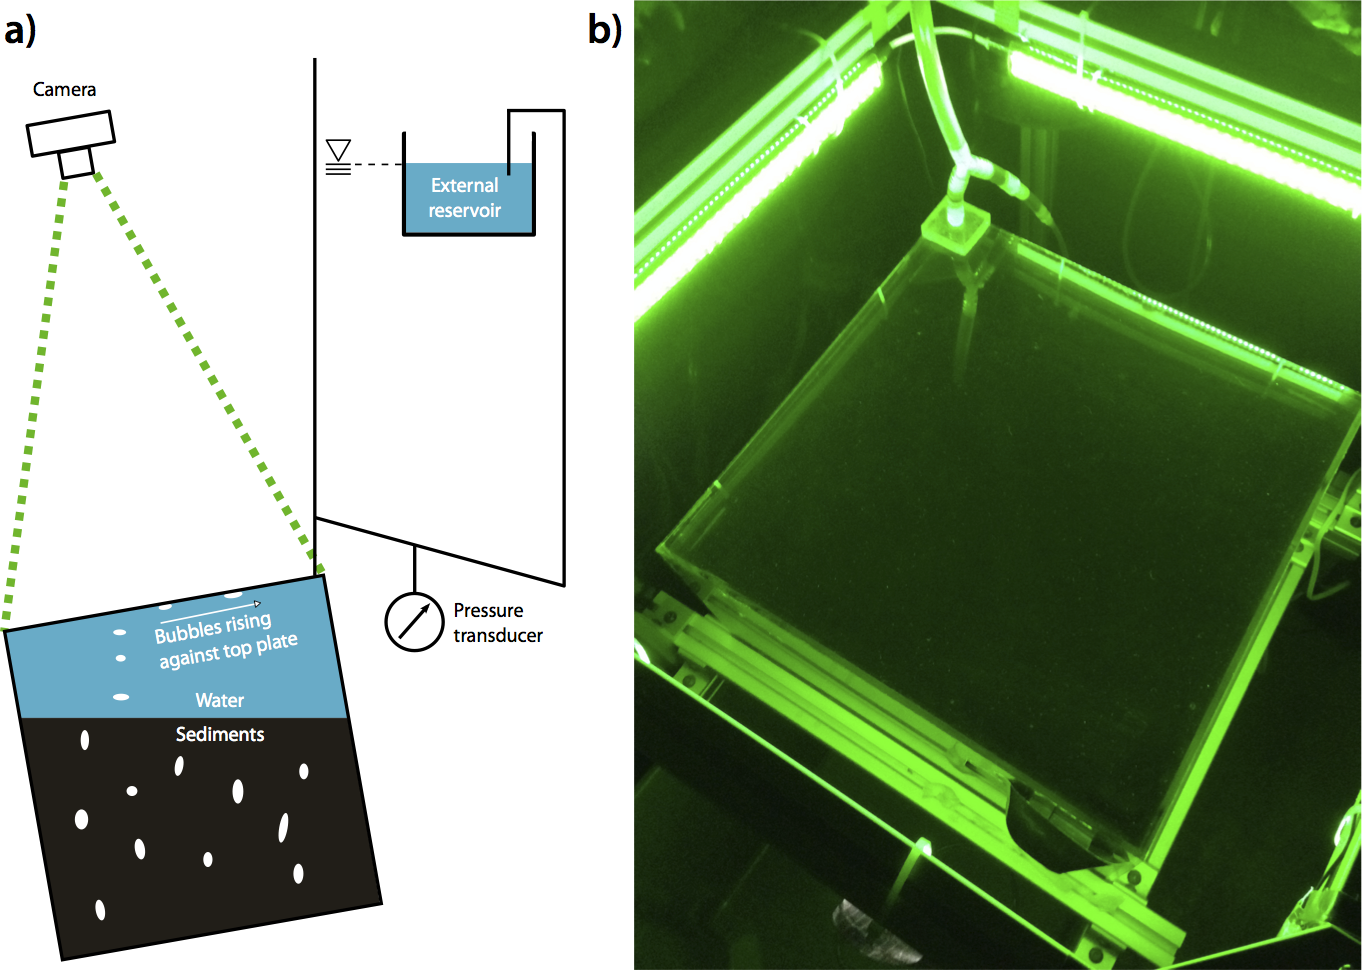
Introduction
 Documentation of data for the paper:
Persistence of bubble outlets in soft, methane-generating sediments.
Benjamin P. Scandella, Kyle Delwiche, Harold Hemond, and Ruben Juanes.
Journal of Geophysical Research - Biogeosciences, accepted, in press. (pdf)
Datasets
Lists of the bubble arrivals (time, location, size), as well as processing parameters. These were used to create most of the figures and for almost all the statistics: bubble_arrivals.zip (12 MB)
- Pressure time series
- Time series of differential pressure from the water level: tank_pressure.zip (55 MB)
- Time series of barometric pressures recorded in the lab: barometric_pressure.zip (750 KB)
Lists of active regions identified from the composite flux for each experiment, using spatial clustering. These were used to make Figs. 21b and 22: activity_clusters.zip (30 KB)
Peak levels from gas analysis on the gas chromatograph: GC_peak_levels.csv (1 KB)
Detailed description
Lists of the bubble arrivals (time, location, size), as well as processing parameters. These were used to create most of the figures and for almost all the statistics. These files (approximately 1400 files, 12 MB total) contain the information required to analyze the spatial and temporal variability of the bubble release process. Each file contains data from one hour of experimental time, and the name of the file refers to its time range with the format YYYYMMDDThhmmss. For example, the file “bubbles_20160220T120000-20160220T130000.mat” contains data from 12 pm until 1 pm on February 20th, 2016. Each file contains 4 variables:
- “bubbles”: This variable contains a matrix with one row for every bubble release detected (which may have anywhere from 10 to 10,000 bubbles in a single file, though typically only hundreds). Each row of the matrix “bubbles” specifies 1 bubble, with the columns specifying:
- Start datenumber
- Time since previous image (seconds)
- x (cm)
- y (cm)
- area (cm2)
- spatial sum of intensity ((0-28)*nPixel)
- volume (mL)
- “exParams”: structure containing experimental parameters, including:
- darkroomOpenDates: [n-by-2 double] array containing the start and end datenumbers of periods when the dark room was open (by either manual or automatic identification), so that the data during that period are not reliable.
- expName: string containing the name of the experiment
- photoEndTime: datenumber when photo acquisition ended
- photoStartTime: datenumber when photo acquisition began
- “proParams”: structure containing parameters used for processing, including:
- darkroomCountdown: how many seconds to allow collection of data after an image with automatically-identified state of having the darkroom open (by brightness in an area of the floor that became illuminated when the darkroom was open, among other criteria)
- cluster.dbscan: structure containing variables used to identify bubbles from the raw images using the dbscan algorithm
- track: structure containing parameters used for distinguishing bubble arrival from bubble motion
“tPeriods”: n-by-2 array, with n time periods where the image acquisition equipment was active within the time period covered by the current file (default 1 row spanning the entire period). The first column specifies the start-datenum, and the second column specifies the ending datenum.
- “bubbles”: This variable contains a matrix with one row for every bubble release detected (which may have anywhere from 10 to 10,000 bubbles in a single file, though typically only hundreds). Each row of the matrix “bubbles” specifies 1 bubble, with the columns specifying:
Pressure time series
- Time series of differential pressure from the water level (5 files, 57 MB). Each file contains 2 variables:
- WLcm: time series of water level measurements, measured in cm above the external top of the tank
- tWL: time series of datenumbers corresponding to each of the measurements
- Time series of barometric pressures recorded in the lab (1 file, 1 MB).
- solinstDates: time series of datenumbers
- solinstLevels: time series of barometric pressure measurements, in m of water pressure
solinstTems: time series of temperature measurements, in degrees C
Lists of active regions identified from the composite flux for each experiment, using spatial clustering. These were used to make fig. 21b and 22 (5 files, 50 kb). Each file contains all the active regions (“clusters”) from a given experiment, and each cluster’s data is in a row of each of the following arrays:
- QCluster : flow rate (mL/day) through the pixels comprising the cluster
- areaCluster : area (cm^2) of the cluster
- fCluster: fraction of the total gas volume released during the experiment that came through a given cluster. Does not sum to 1 because some flux came from outside the clusters.
- tCluster: datenumbers of the start and end of the cluster’s period of significant activity.
- tsCluster: time series of flow rates (mL/day) for each day during the experiment
- vCluster: volume (mL) of gas released through the cluster
xCluster: x- and y- coordinates of the centroid of the cluster
Peak levels from gas analysis on the GC (1 .csv file, 1 KB): spreadsheet with one row for each sample or standard run through the GC. Columns specify:
- Sample name
- Time of day
- Sample date: when the sample was collected
- Sample number: number of sample collected on the given date-number
- Volume injected into the GC (mL)
Then, for each of the analytes (O2, N2 and CH4):
- Peak level (labeled simply as “O2,” “N2,” and “CH4,” respectively
- zero level
- Net signal (peak minus zero)
- Order in which the sample was run
- Cal_range: identifier specifying which of the two manually-identified calibration periods that the sample fell under
- [analyte]_standard: boolean value specifying whether the injected gas was a standard for the given analyte
- f[analyte]: percent of the standard whose content was known or assumed to have a given concentration.